2024 Montana Election Results
Election Date: Nov. 5, 2024 | Updated 2:39 PM EST Dec. 5, 2024
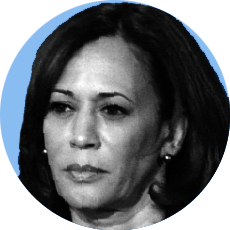
On Nov. 5, voters across the U.S. cast final ballots that will set the direction of the country, state and local municipalities for years to come. Heading into Election Day, Democrat Kamala Harris and Republican Donald Trump were locked in a tight race for the White House, and control of both the U.S. Senate and House was hanging in the balance.
U.S. President - Montana Results
99% Est. Vote Counted
| Candidate | Total Votes | % Votes | |
|---|---|---|---|
 | Donald Trump (R) | 351,945 | 58.4% |
 | Kamala Harris (D) | 231,761 | 38.5% |
 | Robert Kennedy (O) | 11,822 | 2.0% |
 | Chase Oliver (LB) | 4,272 | 0.7% |
 | Jill Stein (GR) | 2,876 | 0.5% |
County-By-County Results Map
Harris Lead
Trump Lead
Tied
No Results
Mail-in and early votes may not be included.
Montana Governor
99% Est. Vote Counted
*Incumbent
| Candidate | Total Votes | % Votes |
|---|---|---|
| Greg Gianforte (R) * | 354,448 | 58.9% |
| Ryan Busse (D) | 232,547 | 38.6% |
| Kaiser Leib (LB) | 15,184 | 2.5% |
Montana U.S. Senate
99% Est. Vote Counted
*Incumbent
| Candidate | Total Votes | % Votes |
|---|---|---|
| Tim Sheehy (R) | 319,579 | 52.6% |
| Jon Tester (D) * | 276,184 | 45.5% |
| Sid Daoud (LB) | 7,265 | 1.2% |
| Robert Barb (GR) | 4,006 | 0.7% |
Montana U.S. House
District 1
99% Est. Vote Counted
*Incumbent
| Candidate | Total Votes | % Votes |
|---|---|---|
| Ryan Zinke (R) * | 168,669 | 52.3% |
| Monica Tranel (D) | 143,824 | 44.6% |
| Dennis Hayes (LB) | 9,964 | 3.1% |
District 2
99% Est. Vote Counted
| Candidate | Total Votes | % Votes |
|---|---|---|
| Troy Downing (R) | 181,548 | 66.0% |
| John Driscoll (D) | 93,549 | 34.0% |
Montana State Senate
District 2
99% Est. Vote Counted
| Candidate | Total Votes | % Votes |
|---|---|---|
| Dave Fern (D) | 6,860 | 52.4% |
| Doug Adams (R) | 6,227 | 47.6% |
District 3
99% Est. Vote Counted
*Incumbent
| Candidate | Total Votes | % Votes |
|---|---|---|
| Carl Glimm (R) * | 9,590 | 70.1% |
| Angela Kennedy (D) | 4,100 | 29.9% |
Montana State House
District 1
99% Est. Vote Counted
*Incumbent
| Candidate | Total Votes | % Votes |
|---|---|---|
| Neil Duram (R) * | 5,541 | 80.0% |
| Dakota Adams (D) | 1,388 | 20.0% |
District 2
99% Est. Vote Counted
| Candidate | Total Votes | % Votes |
|---|---|---|
| Tom Millett (R) | 4,600 | 78.7% |
| Brad Simonis (D) | 1,245 | 21.3% |
Ballot Initiative Results
127 - Require Majority Vote to Win Election
99% Est. Vote Counted
| Choices | Total Votes | % Votes |
|---|---|---|
| No | 348,649 | 60.4% |
| Yes | 228,821 | 39.6% |
128 - Right to Abortion
99% Est. Vote Counted
| Choices | Total Votes | % Votes |
|---|---|---|
| Yes | 344,915 | 57.8% |
| No | 252,234 | 42.2% |
126 - Top-Four Primary
99% Est. Vote Counted
| Choices | Total Votes | % Votes |
|---|---|---|
| No | 300,495 | 51.1% |
| Yes | 287,698 | 48.9% |
Other Election Results
Attorney General
99% Est. Vote Counted
*Incumbent
| Choices | Total Votes | % Votes |
|---|---|---|
| Austin Knudsen (R) * | 352,557 | 59.7% |
| Ben Alke (D) | 237,835 | 40.3% |
Auditor
99% Est. Vote Counted
| Choices | Total Votes | % Votes |
|---|---|---|
| James Brown (R) | 358,533 | 61.4% |
| John Repke (D) | 225,138 | 38.6% |
Public Service Commission - District 2
99% Est. Vote Counted
| Choices | Total Votes | % Votes |
|---|---|---|
| Brad Molnar (R) | 64,825 | 59.1% |
| Susan Bilo (D) | 44,822 | 40.9% |
Public Service Commission - District 3
99% Est. Vote Counted
| Choices | Total Votes | % Votes |
|---|---|---|
| Jeff Welborn (R) | 77,169 | 61.8% |
| Leonard Williams (D) | 47,674 | 38.2% |
Public Service Commission - District 4
99% Est. Vote Counted
*Incumbent
| Choices | Total Votes | % Votes |
|---|---|---|
| Jennifer Fielder (R) * | 69,903 | 54.7% |
| Elena Evans | 57,897 | 45.3% |
Secretary of State
99% Est. Vote Counted
*Incumbent
| Choices | Total Votes | % Votes |
|---|---|---|
| Christi Jacobsen (R) * | 364,321 | 61.4% |
| Jesse Mullen (D) | 210,536 | 35.5% |
| John Lamb | 18,490 | 3.1% |
Superintendent of Public Education
99% Est. Vote Counted
| Choices | Total Votes | % Votes |
|---|---|---|
| Susie Hedalen (R) | 348,258 | 59.3% |
| Shannon O'Brien (D) | 238,756 | 40.7% |
Supreme Court - Chief Justice
99% Est. Vote Counted
| Choices | Total Votes | % Votes |
|---|---|---|
| Cory Swanson | 296,417 | 53.8% |
| Jeremiah Lynch | 254,509 | 46.2% |
Supreme Court Clerk
99% Est. Vote Counted
*Incumbent
| Choices | Total Votes | % Votes |
|---|---|---|
| Bowen Greenwood (R) * | 330,401 | 56.8% |
| Erin Farris-Olsen (D) | 226,200 | 38.9% |
| Roger Roots | 24,635 | 4.2% |
Supreme Court - Justice #3
99% Est. Vote Counted
| Choices | Total Votes | % Votes |
|---|---|---|
| Katherine Bidegaray | 299,343 | 54.1% |
| Dan Wilson | 254,209 | 45.9% |