2024 Oklahoma Election Results
Election Date: Nov. 5, 2024 | Updated 2:39 PM EST Dec. 5, 2024
Oklahomans have split their allegiances in past elections, voting Republicans into federal office while putting Democrats in local seats. Since 2000, the number of Republican voters registered in the state has steadily increased, widening the margin between them and the number of registered Democrats. As the state grapples with solutions to education, poverty and development the 2024 election may help decide just which way those political answers will lean.
U.S. President - Oklahoma Results
99% Est. Vote Counted
| Candidate | Total Votes | % Votes | |
|---|---|---|---|
 | Donald Trump (R) | 1,036,213 | 66.2% |
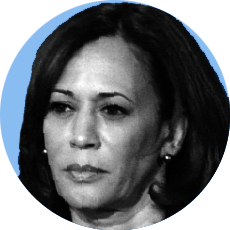
 | Kamala Harris (D) | 499,599 | 31.9% |
 | Robert Kennedy (I) | 16,020 | 1.0% |
 | Chase Oliver (LB) | 9,198 | 0.6% |
 | Chris Garrity (I) | 5,143 | 0.3% |
County-By-County Results Map
Harris Lead
Trump Lead
Tied
No Results
Mail-in and early votes may not be included.
Oklahoma U.S. House
District 1
99% Est. Vote Counted
*Incumbent
| Candidate | Total Votes | % Votes |
|---|---|---|
| Kevin Hern (R) * | 188,832 | 60.4% |
| Dennis Baker (D) | 107,903 | 34.5% |
| Mark Sanders (I) | 15,766 | 5.0% |
District 2
99% Est. Vote Counted
*Incumbent
| Candidate | Total Votes | % Votes |
|---|---|---|
| Josh Brecheen (R) * | 238,123 | 74.2% |
| Brandon Wade (D) | 68,841 | 21.4% |
| Ronnie Hopkins (I) | 14,061 | 4.4% |
Oklahoma State Senate
District 1
*Incumbent
| Candidate | |
|---|---|
| Micheal Bergstrom (R) * | Unopposed |
District 3
99% Est. Vote Counted
| Candidate | Total Votes | % Votes |
|---|---|---|
| Julie McIntosh (R) | 28,812 | 78.7% |
| Margaret Cook (I) | 7,785 | 21.3% |
Oklahoma State House
District 1
99% Est. Vote Counted
*Incumbent
| Candidate | Total Votes | % Votes |
|---|---|---|
| Eddy Dempsey (R) * | 11,949 | 86.3% |
| Victoria Lawhorn (LB) | 1,903 | 13.7% |
District 2
*Incumbent
| Candidate | |
|---|---|
| Jim Olsen (R) * | Unopposed |
Ballot Initiative Results
834 - Require Citizenship to Vote
99% Est. Vote Counted
| Choices | Total Votes | % Votes |
|---|---|---|
| Yes | 1,207,520 | 80.7% |
| No | 288,267 | 19.3% |
833 - Create Public Infrastructure Districts
99% Est. Vote Counted
| Choices | Total Votes | % Votes |
|---|---|---|
| No | 898,526 | 61.6% |
| Yes | 559,982 | 38.4% |
Other Election Results
Corporation Commissioner
99% Est. Vote Counted
| Choices | Total Votes | % Votes |
|---|---|---|
| J. Brian Bingman (R) | 979,802 | 63.7% |
| Harold Spradling (D) | 444,736 | 28.9% |
| Chad Williams | 114,257 | 7.4% |